
Get branding tips and expert advice delivered straight to your inbox.
Insights Data Connector: The Missing Link Between Brand Goals and Content Performance
What’s working and what isn’t when it comes to your brand’s content? The ability to answer this question – and accurately – is essential to finding sustained success with today’s high-volume digital campaigns.
As brands look to eliminate blindspots in content planning and production, asset data combined with a business intelligence (BI) tool can paint a powerful picture of performance. Making that connection however, is often easier said than done.
That’s why Insights Data Connector is such a game-changer. It allows data from disparate parts of your marketing organization to connect with your content data, providing a more complete look at performance and uncovering deeper takeaways, down to the individual asset level, that will help strategically drive brand objectives.
How it Works
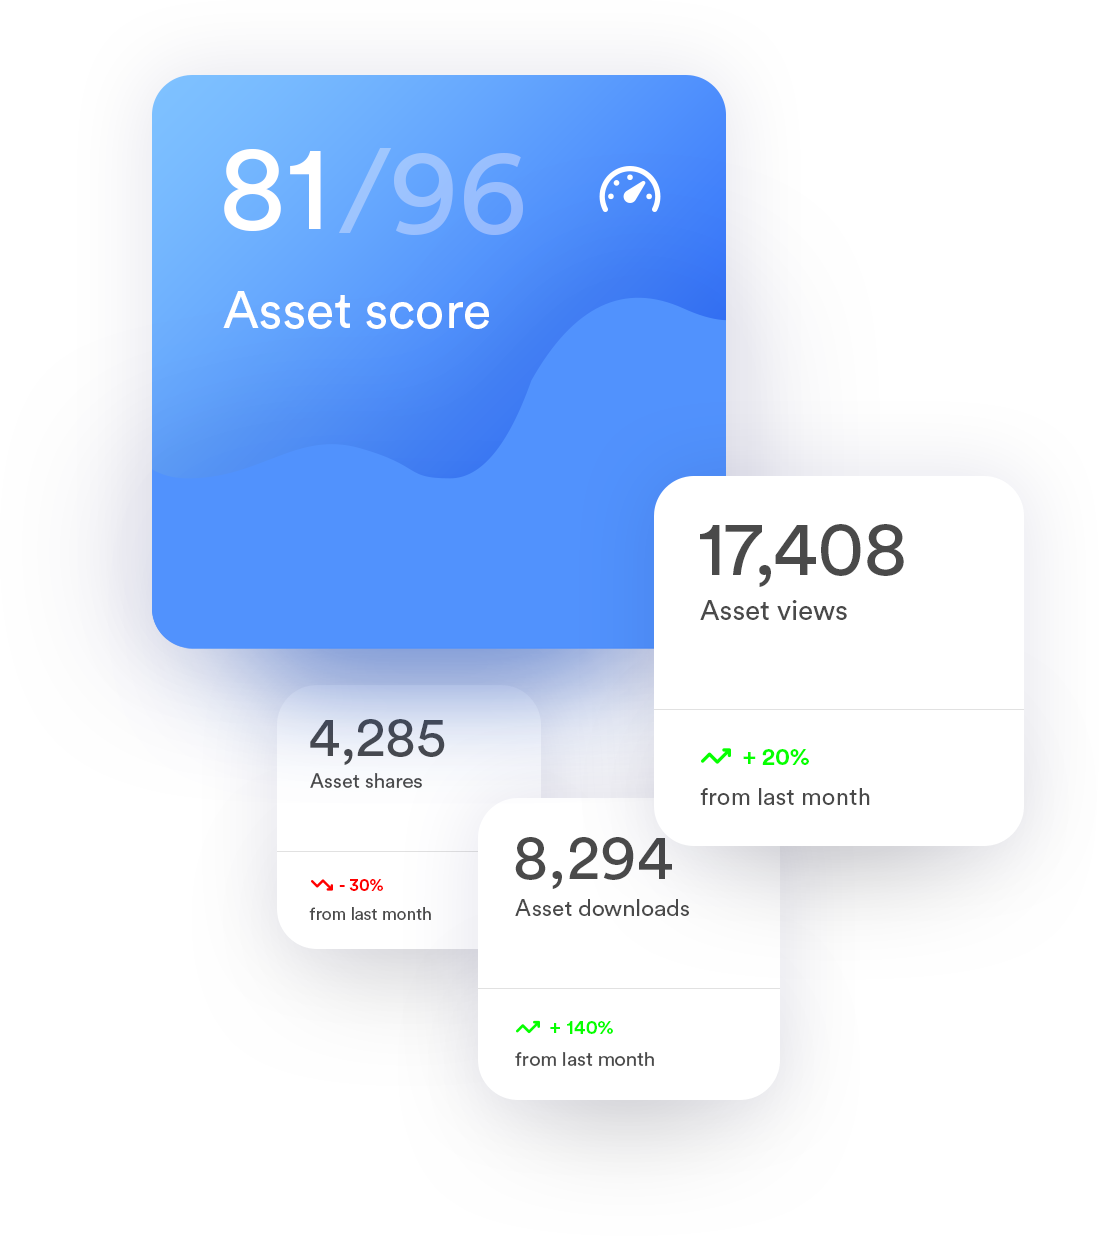
Insights Data Connector allows brands to access data from Brandfolder directly from the big query compatible BI tools of their choice, such as Google Data Studio, Looker or Tableau. Once connected, performance metrics like views, downloads and shares can be evaluated along with other relevant metadata like asset title, tags, campaign and creation date for custom reports.
Brandfolder’s Insights Data Connector now supports additional insights so teams can better understand who is using their DAM, how content is being shared, and which assets are being used the most, helping teams find actionable insights and opportunities for improving engagement.
By combining these reports with other data sources around budget, website analytics or campaign performance metrics, teams can glean more valuable insights that strengthen their overall strategy in a variety of ways:
- Assess the ROI of campaigns and individual assets
- Optimize content taxonomy for improved organization and asset findability
- Apply asset metrics to optimize strategic planning and production of creative content
- Utilize conversion reports and A/B testing to understand content performance across campaigns and digital channels
How it’s Used
As projects and campaigns take shape, Brandfolder provides teams centralized access to assets and metrics into content performance. By connecting Brandfolder with a BI tool, brands scaling those activities can better leverage data for a more complete view into the impact of content across their digital presence.
For marketing teams:
The highly-targeted and personalized nature of today’s marketing strategies requires content that’s designed with high-intent and the goal of fulfilling a specific purpose. Brandfolder allows quick access to the most relevant assets. With tags, labels, CDN usage, share link and other asset data available, Insights Data Connector uncovers how creative may affect campaign performance.
Ultimately, this leads to a more data-driven understanding of how assets are driving results in order to further improve campaigns.
For brand and creative teams:
Creative and marketing teams work together to create a better connection between the brand and their target audience. With Insights Data Connector, those teams are able to layer AI-powered tags and touch point data to determine what creative truly resonates and on which channels.
Ultimately, this means creatives are able to better align their strategy and production workflows to more efficiently meet brand objectives.
How to Get It
If you’re a Brandfolder customer already using a business intelligence tool, better utilizing your content data is simple. Once activated, your data can be quickly delivered to your BI tool and added to reporting just as you do with any other data source. Contact support@brandfolder.com to learn more or get started.
Just learning about Brandfolder and what DAM has to offer? Get a first-hand look at how content organization and data come together to build stronger brands with a free demo.